
Google AI Mode's Visual Finance Revolution: Charts That Could Change SEO & Investing
Google's AI Mode just got a significant upgrade, and it's poised to shake up how we interact with financial information. The introduction of interactive charts within financial search results isn't just a cool new feature; it's a potential game-changer for SEO, content marketing, and even how everyday South Africans approach investing.
What's New?
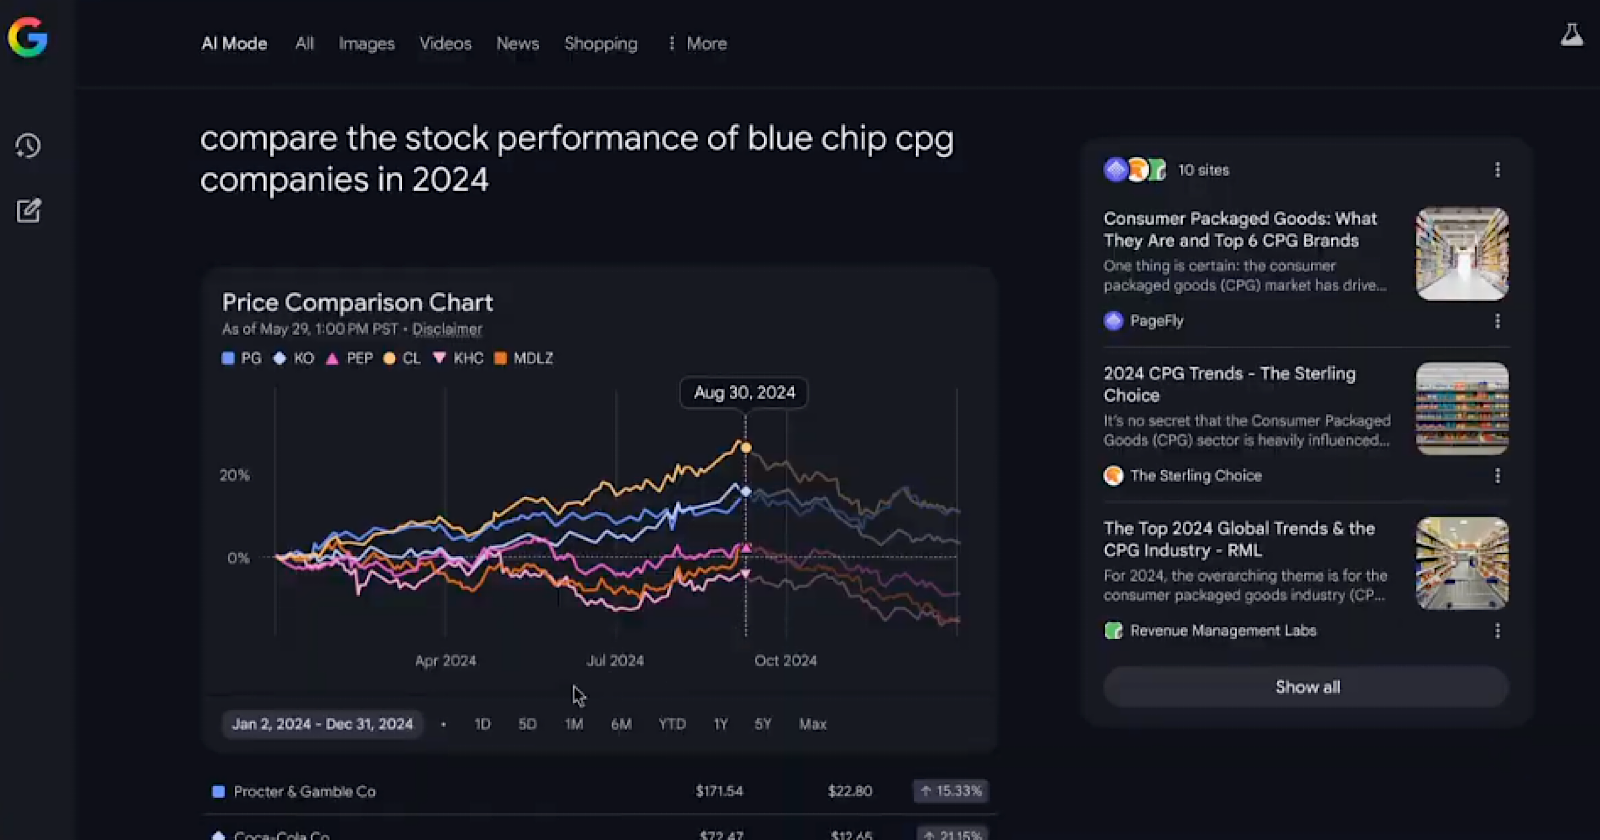
Previously, Google AI Mode offered conversational summaries of search queries. Now, when you ask about financial topics – like comparing investment options, tracking stock performance, or understanding market trends – Google’s AI will generate dynamic charts and graphs directly within the search results. This allows for a visual, intuitive understanding of complex data, moving beyond static numbers and text.
Why This Matters for South Africans
For South African investors, particularly those navigating a sometimes volatile market, this is a big deal. Access to clear, visual data can empower individuals to make more informed decisions. Imagine easily comparing the historical performance of different ETFs, or quickly grasping the impact of inflation on your savings – all within a Google search. This accessibility could democratize financial literacy, encouraging more people to engage with investing.
The SEO & Content Marketing Impact
The implications for SEO and content marketing are equally significant. Previously, content creators focused on optimizing for keyword rankings and providing comprehensive written explanations. Now, the landscape is shifting. Here's how:
- Visual Content is King: Infographics, data visualizations, and interactive charts will become even more valuable assets. Websites that can present financial data in a compelling and user-friendly visual format will likely see a boost in rankings.
- Schema Markup is Crucial: Implementing schema markup to clearly define the data being presented will be vital for Google to understand and leverage the information for AI Mode’s chart generation.
- Focus on User Intent: Google is increasingly prioritizing results that directly answer user queries. Content that anticipates financial questions and provides clear, actionable insights, supported by visual data, will perform better.
- The Rise of 'Featured Snippet' Charts: We can expect to see Google increasingly pulling data directly from websites to populate these AI Mode charts, essentially turning your data into a 'featured snippet' for financial searches.
Challenges & Opportunities
While exciting, this new feature presents new challenges. Ensuring data accuracy and transparency will be paramount. Content marketers need to adapt their strategies to focus on creating visually rich, data-driven content that aligns with Google's AI capabilities. The opportunity lies in becoming a trusted source of financial information, providing users with the tools and insights they need to navigate the complexities of the market.
Looking Ahead
Google's AI Mode's visual finance capabilities are still in their early stages. We can expect to see further refinements and integrations over time. For South African businesses and content creators in the financial space, now is the time to embrace this shift and start thinking about how to leverage visual data to connect with audiences and thrive in this evolving search landscape.